It’s raining RAISE at the moment. November is the month statistical analyses and dashboards become the group reader in schools across the land. Many people have a problem navigating these number dense documents.
For those of us who can just about make our way around them the challenge is drawing valid conclusions and inferences from the data available. Too often senior leaders, governors and inspectors draw supposedly solid conclusions from the flimsiest of data.

With the new RAISE being significantly different to what has gone before here are a couple of thoughts. The new green and red coding system is pretty much in your face, so you won’t miss any seemingly important messages. I wouldn’t worry too much about the shade of green or red. Identifying the top or bottom 10% is a pretty arbitrary decision; it could have been the top/bottom 20% (quintile) or 25% (quartile). Sig+ is statistically meaningful as is sig-; it’s important to focus some attention on these aspects of RAISE. These “significants” are getting you to look in a certain place – high prior attainment, disadvantaged, ethnic group, gender. The data won’t give you reasons for under or over performance; you’ll have to look beyond the data for those. They are suggesting good places to start searching for your next improvement or the securing of a significant strength.
Have a look at your school’s figures for all pupils and then disadvantaged. For the vast majority of schools disadvantaged pupils will have lower attainment or made less progress than all pupils. Now if you look at the figures below the schools, it looks on first reading as if nationally disadvantaged pupils have done better than all pupils. This is not the case! The national figure under the column heading “disadvantaged” is actually the national figure for advantaged pupils. No wonder some people struggle with RAISE.
What the document is seeking to do is compared your school’s outcomes for disadvantaged pupils with those for advantaged pupils nationally. It’s all about raising the bar and closing the gap. It’s high on aspiration but is data garbage (as Tom Sherrington might say). What we really should be comparing is like with like; how did disadvantaged pupils in your school do compared to disadvantaged pupils nationally. Was the education received by disadvantaged pupils more or less effective at your school than nationally?
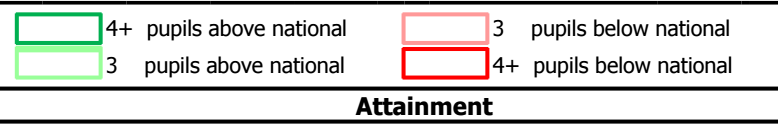
The tables with the green and red borders are real nonsense. I’m tempted to just say ignore them as they don’t really mean anything. My guess is the bigger your cohort the more likely you are to vary by three or four pupils from the national figure. What valid conclusions you can draw from this goodness only knows. Another page for the data dustbin possibly.
Take care when looking at sub-groups where numbers are so low that there are no meaningful conclusions that you can draw from the data. Where there are only a couple of pupils the outcome, good or not so, is too much down to chance to convey any great meaning. Also note that the data for each ethnic sub-group is compared to all pupils nationally (Attainment 8 = 49.34) rather than the same sub-group nationally.

With all that crystal clear, it’s worth keeping an eye on outliers and the impact they have on your data. The biggest outliers at St. Mary’s has a Progress 8 score of -3.29 and the next a Progress 8 score of -2.25. This means that their Attainment 8 scores will be -32.9 and -22.5 respectively. To counteract the impact of these outliers every pupil in a sub group of 50 would need to overachieve by a full grade in a subject to get you to zero. If they are part of a sub-group that only has five other members all the other pupils would need to overachieve by a full grade in every one of their Attainment 8 subjects to get a zero. Outliers can really impact on your progress scores so look out for them when pulling together the story of this year’s outcomes. Don’t use them as excuses; how can we reduce variability for pupils who have massive challenges that block their educational progress?
My suggestion to you is look for patterns and stories in the data that correlate with other information you have. You knew the year group, you know your school. Let the data challenge you and add to your understanding of the school’s narrative; don’t be blinded by the data nor blind to it. Make sure you know what to celebrate and what needs fixing then start the creative methodical work of determining possible interventions, implementing them effectively and evaluating their impact.
Hope you enjoy this year’s RAISE but don’t expect it to be around for much longer. I think we’ll see a radically revised documents next year.


Stephen I work in a local authority performance and data team and am currently supporting primary schools with how to interpret their RAISE reports. I enjoy reading your posts about data and accountability issues, thank you for sharing your thoughts on 2016 RAISE analysis. In the primary reports the ethnic group analysis is also compared to all pupils nationally for KS1 and KS2, but the comparator is pupils of the same ethnic group for Phonics! No wonder this is puzzling for school leaders and governing bodies. Thanks for your useful tip about paying attention to outliers. Virtually every school I have worked with this term has had their performance on value added measures skewed by a small number of very high or very low progress scores, I also encourage schools to look carefully at individual pupil data, especially identifying where high attainers actually have negative progress scores. I’m sure we all await with interest what will fill the RAISE vacuum next spring!
Posted by Becky Lawrence | November 23, 2016, 9:13 amReally useful, thank you for your insight.
Posted by Sam Gorse | November 24, 2016, 12:33 pmThanks for this Stephen. I’m taking on data from January due to a collegue leaving. I would appreciate any support you can give on raise, FFT Aspire etc to help me get round the jargon and know what to look for.
Thank you
Posted by Neil Smith | November 25, 2016, 7:22 amReally useful overview of what to focus on in the new style document, especially the impact of outliers. Thanks.
Posted by Caseby's Casebook | November 26, 2016, 2:17 pmAs an independent school head, member of NAHT since early 80s, I’ve taken a real interest in state sector methods for many years. Our sector has no access in RAISE online, and has developed its own approach using CEM centre benchmarking, attitudinal and value added tools from age 5 to 18. In many ways we have the same outlier effect, and it’s great to see this reminder on their negative effect. I approve of the principal around being able to discard the negative bookend effects. If we wish schools to feel the system works for them the plus outliers must be permitted to remain in, for these children deserve to have their effect on others appreciated.
Posted by jameswilding | February 11, 2017, 3:25 pm