The beginning of many school years often starts with an analysis of the previous year’s results. This can be a complex and time consuming business which can send a number of more “statistically challenged” teachers heading for a darkened room to lie down in. There is a balance to strike between having enough data to analyse in depth without “analysis for analysis” sake and the potential to miss the main learning points.
The #5MinResultsAnalysis has been produced by @LeadingLearner and @TeacherToolkit to guide you through the process of analysing your own/department’s/phase’s/school’s results and leads you towards “The Big Picture”, so you know what went well and what you want to improve for this year’s classes.
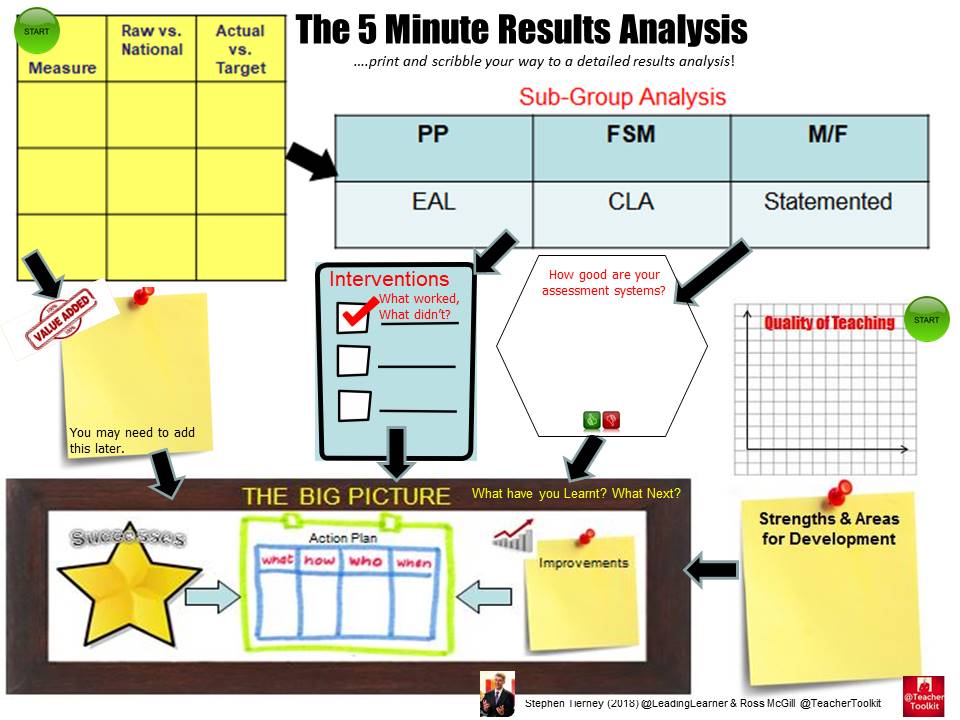
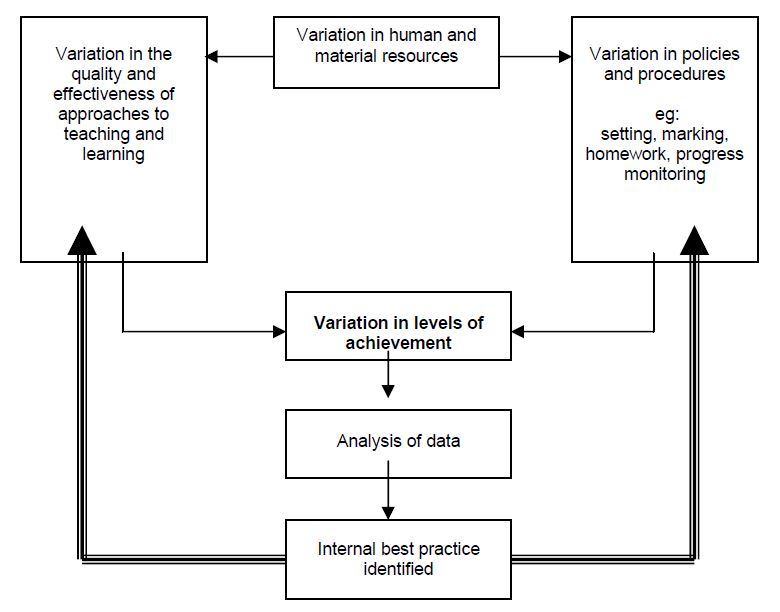
The #5MinResultsAnalysis looks at data, interventions, assessment systems and the quality of teaching. The Reducing In-school Variation: Making Effective Practice Standard Practice Report looked at variations, in the same school between departments/phases or across years, as a combination of the “variation in the quality and effectiveness of approaches to teaching and learning” or “variation in policies and procedures”. The #5MinResultsAnalysis has a look at both so there are two starting points – you decide where to begin..
The #5MinResultsAnalysis
Data Analysis
Measure – There are a number of key measures that teachers and schools use – in primary schools, Expected Standard & ES+ alongside KS1-2 progress. In secondary schools Attainment 8, Progress 8 (available later in the term), A*-CEM, Aand E-bacc (if you focus on it). Sixth Forms look at A*-E, A*-B, point score per subject & overall alongside progress measures; for example, ALPS. The actual outcomes for these key measures can be compared against national averages and target grades at a class/subject level.
Don’t forget to also look at a breakdown of the different parts of the exam or SAT that are available. Is there a difference in how well pupils did on various questions/components? Anything you need to do different next year?
Value Added – There are various value added measures that can be used. Some are produced by commercial companies others in the school’s official IDSR. This document tends to come in later in the academic year. This measure is important because it places your own/school’s results in a context based upon a baseline of the pupils actually in your class/the cohort; some contextualise beyond the prior attainment used in official figures and are even more revealing.
Sub-Group Analysis – We want all pupils to do well. Nationally there are some groups whose performance lags behind. In addition to those listed you may also want to look at different ethnic groups, travellers, children of forces personnel or transient children if there are a number in your class/school.
–PP: Pupil Premium (FSM Ever6), FSM: Free School Meals, CLA: Children Looked After, M/F: Male versus female, EAL: English as an Additional Language and pupils with special educational needs – Statemented
–Don’t forget G&T: Gifted & Talented pupils – are they making the progress expected and achieving top grades.
*One word of warning about analysing sub-groups; where numbers are low, as they will be at a class level and can be at a school level, drawing conclusions with any degree of certainty is fraught with danger. Basically, take care.
Interventions – Many teachers and schools have particular intervention programmes. They require a great deal of commitment and resources to implement but which ones were effective and which ones were not? If an intervention was not effective needs it need changing or simply dropping so teachers can focus more on what happens in the classroom, day in and day out.
Assessment Systems – This is a very important health check on one of the main systems found in schools. How effective were your assessment systems at helping pupils learn; did they provide feedback to pupils and teachers on areas that needed further study? Too many systems are focussed on monitoring rather than learning.

Quality of Teaching
Quality of Teaching – What was the typical class room experience of the pupils like? Where there any extenuating staff circumstances you need to take account of – absences, extended leave?
The Big Picture (What have you Learnt? What Next?) – This is the important part!
When you’ve looked at all the detail, what have you learnt? Don’t forget to capture what went well, you will want to do this again. Can you make these your/the departments super strengths? What do you want to improve for the next set of pupils? Time to action plan – who is going to do what by when and how? The clock is already ticking to next year’s rests and exams so no time to lose. Pick a few big issues that you can make a real impact on.

When choosing the few big issues to focus on remember to keep an eye on what you can influence and is in your control and what is not. There isn’t much point in fretting, getting annoyed or losing sleep on things that are simply not in your sphere of influence. The maddening changes to GCSE English grade boundaries in Summer 2012 is one such thing.
I hope that this year’s results were good for your children/students but if not try to step back and be objective in your analysis. All good headteachers look for an accurate, open and honest analysis of results. Talking of good headteachers, here’s a blog post from John Tomsett’s which may be of interest, “What I did as a Headteacher When Our GCSE Results were in Decline”.
The #5MinResultsAnalysis can be downloaded here:


WWW:
Like the diagram as an overview and how the parts fit together.
Thanks for the links to further reading
EBI:
5 minutes – really?
Posted by Patrick Brocklebank | August 30, 2013, 3:39 pmI think we might need to rethink the hashtag. What about the #50MinResultsAnalysis? Hope it’s useful.
Posted by ExecutiveHT | August 30, 2013, 3:53 pmThanks for sharing yet another idea Stephen. Data isn’t my strong point but will forward to colleagues in our weekly ‘Learning Thoughts’ and let you know how they respond and if there are any takers. If you spot anything on our blogs and web-site that interest you-shout and we will share. [our blogs and web stuff is aimed at engaging with our parents, students and schools we work with, so isn’t quite as philosophical or theoretical as some-just trying to bring explain the latest educational ideas to the masses of Southport-not sure if it is working but worth a try!]
Posted by david jones | August 30, 2013, 6:34 pmThanks for the comment. Southport is a great place, my home town, so keep up the great work.
Posted by ExecutiveHT | August 30, 2013, 6:44 pm