All credit to the Department for Education (you don’t often find that phrase on my blog) for the information they have distributed on the proposed changes to the National Funding Formula. This spreadsheet that allows you to work out whether you are a “winner or loser” in the changes caught my eye.
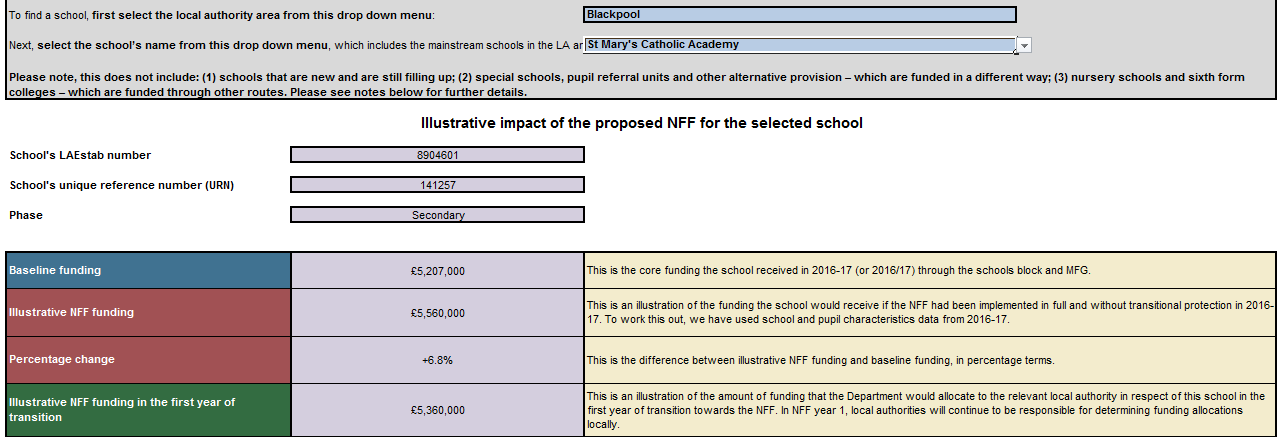
Potential Changes to St. Mary’s Budget as part of the NFF
The proposed percentage change in funding is 6.8% which would equate to about another £350,000 per annum. This will be capped at a 3% change, in the first year, so nearer £150,00 increase. This will just about offset the increased salary, pension and inflation costs. In short we will be standstill rather than needing to cut. I feel for colleagues who are at the other end of the spectrum. Whilst fairer funding is right; agreeing what is fair is much more difficult and when budgets are already reducing it feels particularly harsh.
John Tomsett has written on a number of occasions about the impact of low levels of funding and the measures the school has had to take over a number of years. The spreadsheet is so easy to use I thought I’d have a little look. I hope I don’t cause any offence by including the data, a 4.4% increase, here. All schools data is publically available and that’s as it should be.
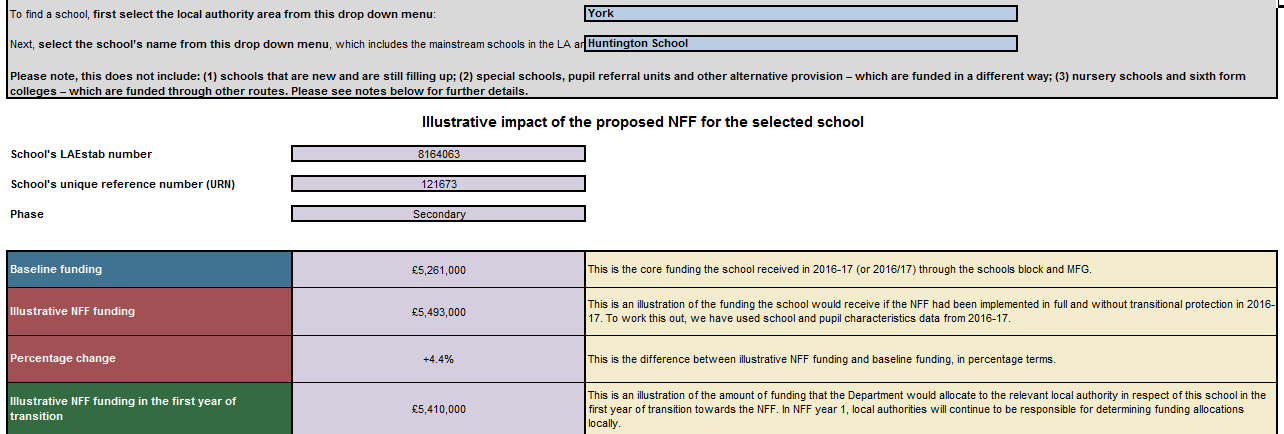
Huntington School, York
The Weald School in West Sussex where Peter Woodman is the Headteacher sees a projected increase of +5.3%, again capped at 3%. Peter infamously led the “Worthless Campaign” that hit the headlines recently.
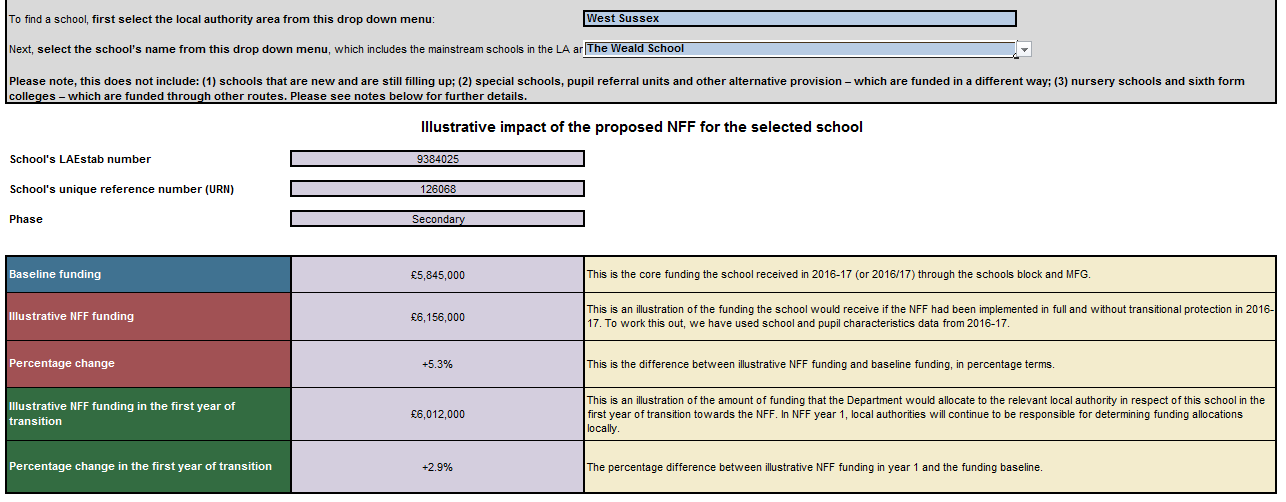
The Weald School, West Sussex
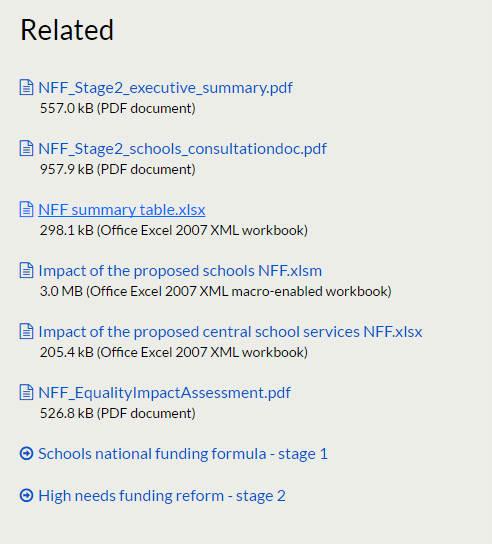
I’ve had a look at some other schools where I know the headteachers and the picture looks much more difficult. Remember any loss is capped at 1.5% per annum. If you would like to work out the impact on your own school’s budget (remember all these figures are provisional) the link to the page is here; scroll down to the spreadsheet labelled “Impact of the proposed schools NFF.xlsm” You may want to pour yourself a glass of mulled wine before you look.
It’s worth remembering that even if your funding is projected to increase you may still be looking for significant savings.


Hi Stephen – my e-mail address is provided. I will be interested to discuss my experience. Thanks for providing a different perspective. Darren
Posted by Darren Walkerdine | December 16, 2016, 9:47 pmHmm. Interesting. You have framed the governments figures here generally quite positively – a brief scan of your page frames 3 apparent winners! But look at schoolcuts.org.uk and the picture is very different due to calculations taking into account not only the national funding formula you have here, but inflation figures published by the National Audit Office, and the reduction in funds due to planned cut in Education Services Grant (ESG) George Osbourne announced in the 2015 Autumn statement.
So for your readers – cuts all round IN REAL TERMS in the examples you selected:
St Marys Catholic Academy, Stoke-on-Trent
Budget change by 2019, cut £98,473.
Losing £467 per pupil
Losing estimated 3 Teachers.
Huntingdon School, York
Budget change by 2019, cut a staggering £625,549
Losing £543 per pupil
Losing estimated 18 Teachers.
Weald School, West Sussex
Budget change by 2019, cut £467,588.
Losing £357 per pupil
Losing estimated 13 Teachers.
Not so optimistic eh?
I expect you might say these calculations (funded by teaching unions) have a predictably negative bias. And I would say the reality might turn out to be somewhere in between – I don’t know – I am no expert! I am just trying to navigate the stats that key organisations put out. I definitely wouldn’t take the government figures on face value, as this would not be critical journalism.
And thus my real objection is the tone of your post here where you have enticed people to your article with your headline incorporating the words “Winners or Losers” as if you’re being objective. Then the main thrust of the article shows 3 winners! The first you allude to a possible “standing still” in real terms. And you say near the bottom “I’ve had a look at some other schools where I know the headteachers and the picture looks much more difficult”. There is nothing vaguely analytical here readers, just someone who has looked at the government stats and repeated, verbatim, the ones they like.
Posted by Tom Barnett | March 22, 2017, 11:00 amThe three schools are deliberate choices; St. Mary’s in Blackpool (the most disadvantaged local authority in England and one of the poorest funded) where I was HT for 14 years; John Tomsett’s school, as John has been writing about the impact of inadequate school funding for years and the Weald school which is led by Peter Woodman who has also superbly led/is leading the Worth Less campaign.
No idea why you think I would have a bias against calculations funded by the teaching unions; for the record, they have done an excellent job and the bigger and wider the coalition against the cuts the better.
This blog post is about the impact of the NFF as proposed; it’s an information give. The bigger issue which I’ve blogged about and wrote about in the HTRT Alternative Green Paper is that sufficiency is the key.
Posted by LeadingLearner | March 22, 2017, 8:36 pmhi Stephen could you link the url for where to find the spreadsheet you have screenshotted above
Posted by Graham | May 13, 2017, 3:40 pmDear Graham,
Think this should get you there https://consult.education.gov.uk/funding-policy-unit/schools-national-funding-formula2/
Regards, Stephen
Posted by LeadingLearner | May 14, 2017, 3:00 pm