Talking at a number of conferences recently I’ve suggested that we’ve got to stop reinventing the wheel and use research wisely. Research provides signposts towards what might work for us, based on what has worked elsewhere and to what extent.
The following suggestion on improving attendance is from Todd Rogers and Avi Feller and was brought our attention by Phil Brown (@ListenLeadLearn) one of the Assistant Headteachers at St. Mary’s Catholic Academy.
What I particularly like about this, apart from the evidence showing a 5-10% improvement in attendance for pupils with chronic absence, is that it makes common sense. My experiences chime with the research evidence; this makes it easier to accept. We’ll be up and running with these letters in the three academies within the Trust early next term.
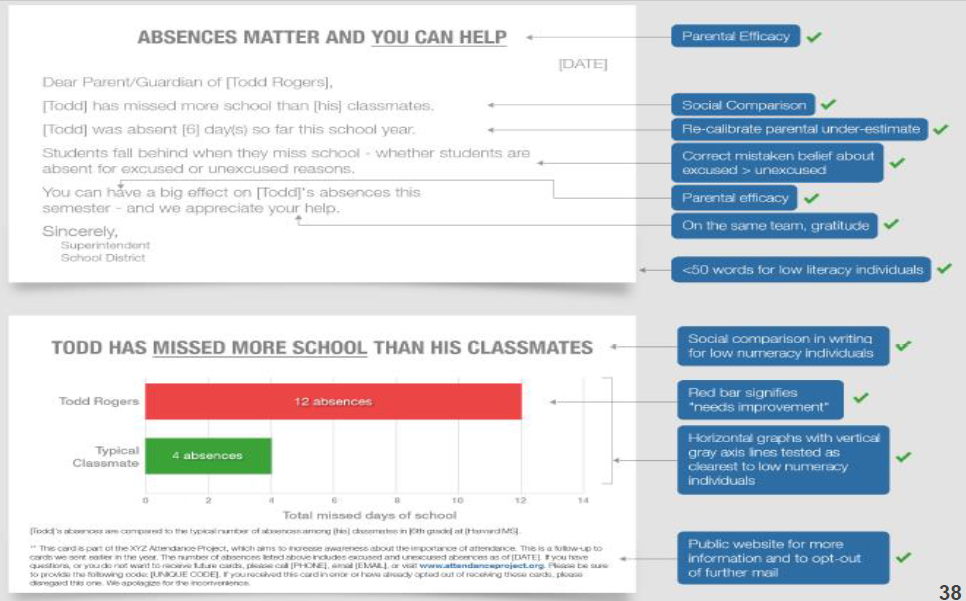
The letters are only 50 words long. Parents with low literacy levels won’t be overawed by them and will be more able to access the contents. I think of some of the letters we have sent home in the past; too many of the parents they were targeted at would simply be unable to fully access them. The letter aims to get parents on side. The message is clear, we need to work together on this. It also addresses a key misconception of many parents about legitimate excuses for being away from school. Whether your child truants a day or was ill; s/he has missed a whole day’s learning.
The bar is particularly clever. Red, for your child’s excessive absences, and green, for class mates, have a simple day count scale which runs horizontally. I think this will really mean something to parents who can mistakenly think 90% attendance is really good. It’s such a high number my child must be doing well. The comparison to class mates – their child’s friend who they have met and know – is much more powerful than the usual “national averages”. Here’s hoping we get the same impact. Great teaching and learning only occurs if the pupil is actually in the class rather than absent at home.
This is a piece of research that is very easy to scale. I’ve no idea how many people might read this blog and use the idea within their own school. There’s no special training need, it isn’t hugely expensive and if successful the letter may lead to improved attendance for all the children in a family.
Please click the image below and pass on this blog; research matters, let’s stop reinventing the wheel.

Photo Credit: http://www.performancemanagementblog.com


The idea of simplicity is excellent, I believe, as is the use of a graphic – not so sure about the red section being left without explanation though. Also, the green almost indicates it is OK to have 4 absences – but what if they were partly truancy? Maybe they should be linked to a red dotted line (top to bottom) showing the critical tipping point of absence in respect of correlation to outcomes?
So Todd would have his bar with 12 absences followed by “= poorer results by X% or less future earnings by £Y per month”.
It could be linked to statements from research such as the two below;
Click to access RR424.pdf
https://www.gov.uk/government/news/almost-400000-pupils-miss-at-least-a-month-of-school
I found a school webpage illustrating on their website very similar to one we used in a previous school – http://www.castlemanor.suffolk.sch.uk/our-academy/attendance-impact/ – hope they don’t mind!
Posted by bocks1 | July 2, 2017, 8:08 amis it possible that this attendance issue has become a little out of hand? If I was spoken to this much at work about attendance when I was coming in, it would be harassment.
Posted by Ben | May 12, 2024, 10:19 pmReblogged this on rwaringatl.
Posted by R Waring | July 3, 2017, 9:55 amThe idea of simplicity.it is ok to have a guide using the graph in simple to the way of making an Attendace specially to the facilitator and the learners..
Posted by Ailie Nueva | January 5, 2018, 1:42 amHow do you do the graph
Posted by Joyce | February 7, 2018, 8:39 pmThank you for sharing this. There are many things to be liked about this approach; not t least as it is less threatening and more collaborative than many examples of absentee letters. One thing I am curious about is the inclusion of the data comparing with their peers. I read the original Harvard study and the results there suggested that this step had no impact and that the most effective strategy was simply giving parents the correct data on their own child’s absences to correct their biased beliefs. I’m interested in why you chose to include the comparison data and if you have any update on the effectiveness of this approach in your schools.
Posted by Lesley Tulley | March 12, 2019, 2:08 pmWe just felt it would help our parents understand how good/poor their child’s attendance was. Thankfully all school’s attendance data above national average; can’t claim causation but a relatively easy thing to implement
Posted by LeadingLearner | March 12, 2019, 2:11 pmGood morning,
I think this Looks interesting and easy to implement. Do you have a template document that you would be willing to share.
Kind regards,
Ryan
Posted by Ryan badham | June 5, 2020, 2:01 pmHi Ryan, If you make contact with @listenleadlearn he can help. Phil has various blogs about it.
Posted by LeadingLearner | June 5, 2020, 5:48 pmLove it!
Any chance of a word versio/pdf of the letter?
Thanksmfox@colmers.school
Posted by mfox195628 | June 9, 2021, 4:26 pmLooks great. Could I get a word version, please? RGascoyne@hillocksprimary-ac.org.uk
Thanks
Posted by Rick | June 10, 2021, 9:54 am