With thanks to Jason Bradbury and the Ofsted Data Team, the graphs commented on in Graphically Exposing Ofsted Bias? have been re-labelled to provide greater clarity to the reader. The information I received earlier this evening has been copied below without comment or amendment; you can make up your own mind whether the substantive issues raised in the original blog remain.
Ofsted analysis of inspection outcomes by ethnicity and deprivation
June 2018
1. Background
The original charts were produced by Ofsted in response to a specific query from a member of the public. They were not the output of an in-depth investigation in to the complex issue of the relationship between deprivation, ethnicity, and inspection outcomes.
The enquirer then shared the charts with some news agencies and a blogger. In the resulting articles there were some misunderstandings about the content of the charts, for instance the two charts for secondary schools were interpreted as referring to two different sets of schools, whereas in fact all 3,158 schools with relevant data appear in both charts. Our labelling could have been clearer in this respect.
Ofsted have therefore provided this note to clarify the methodology, the content of each chart, and to provide clearer versions of the original charts. The numbers in each chart, and the groups of schools/pupils covered by each chart, are unchanged. It would be helpful if the websites/blogs that have published the charts could use this note to update their sites, to avoid any further confusion.
Ofsted will also be publishing more in-depth analysis on this topic in due course.
2. The four charts below were all produced using the same methodology:
- Step 1 – Pupil level data from the DfE’s school census January 2017 was used to calculate the number of pupils in each school that are eligible for free school meals (FSM), and from a particular ethnic background.
- Step 2 – this data was used to calculate the number of pupils that were white British and eligible for FSM, as a % of all pupils in the school. Similarly it was used to calculate the number of pupils that were from an ethnic group other than white British, and eligible for FSM, as a % of all pupils in the school. Two separate sets of percentages were calculated for each phase.
- Step 3 – Schools were then ranked on the resulting percentages. Primary and secondary schools were considered separately. Each school was ranked on each measure (white British FSM and not white British/other ethnic group FSM). Decimal places were used for the rankings but the nearest whole number is shown in the charts.
- Step 4 – Within each phase (primary or secondary) the rankings were used to place schools in to one of five bands or quintiles. The bands were of roughly equal size. These bands were unique for each phase and for each group of pupils.
- Step 5 – For each band the proportion of schools judged outstanding/good/requires improvement/inadequate were calculated. Two sets of charts were then produced for each phase, showing the grades by the % of pupils that were white British and FSM, and by the % of pupils that were from another ethnic group and FSM. Each school was included on each chart for that phase – the charts are not mutually exclusive as each school appears on both. 3,158 schools were included in each of the two secondary school charts, and 16,351 schools are included in each of the primary school charts.
Caveats/cautionary notes
- Pupils were only included if they had characteristics data recorded in the census. If their ethnicity or free school meals status was not recorded then the pupil was not included.
- All schools were included as long as they had available data on pupil characteristics (i.e. they had completed the relevant sections of the census) and an Ofsted inspection outcome. This means that some schools, such as newer schools which did not have the necessary data, were not included.
- The FSM indicator used is FSM 6 (also known as FSM ever), which is pupils eligible for FSM at some point in the last six years. This is a larger group than pupils currently eligible for FSM.
- If a school had no FSM pupils in a particular ethnic group then it was given a score of 0%, but was still included in the rankings and bands.
2. Revised versions of the original charts (new titles and labelling)
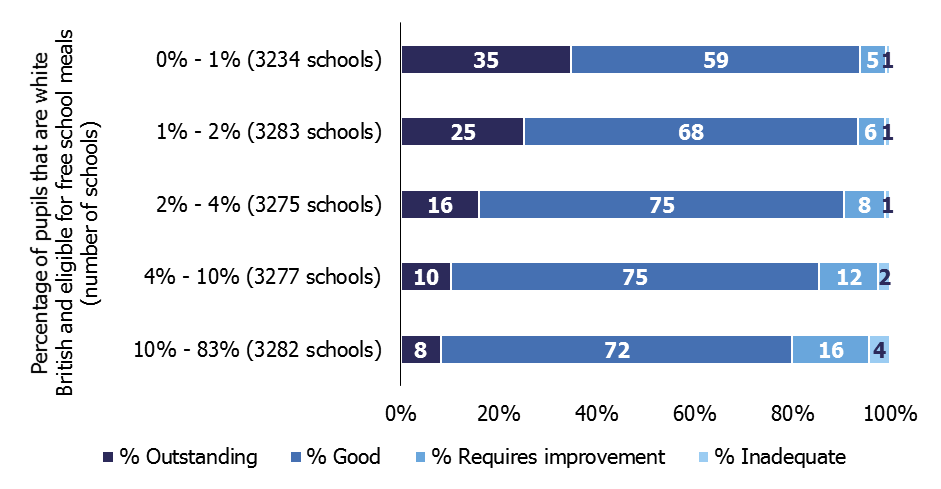
Most recent overall effectiveness grades of secondary schools, by the proportion of pupils that are white British and eligible for free school meals, 30 April 2018

Note: Decimal places of the percentages were used for the rankings, but the nearest whole number is shown in the charts.
Most recent overall effectiveness grades of secondary schools, by the proportion of pupils that are not white British and are eligible for free school meals, 30 April 2018
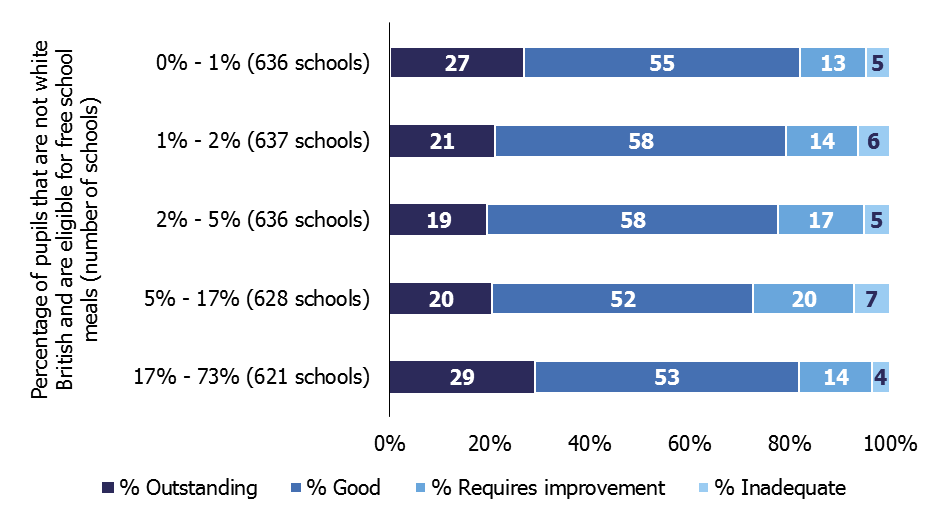
Note: Decimal places of the percentages were used for the rankings, but the nearest whole number is shown in the charts.
Most recent overall effectiveness grades of primary schools, by the proportion of pupils that are white British and eligible for free school meals, 30 April 2018
 Note: Decimal places of the percentages were used for the rankings, but the nearest whole number is shown in the charts.
Most recent overall effectiveness grades of primary schools, by the proportion of pupils that are not white British and are eligible for free school meals, 30 April 2018
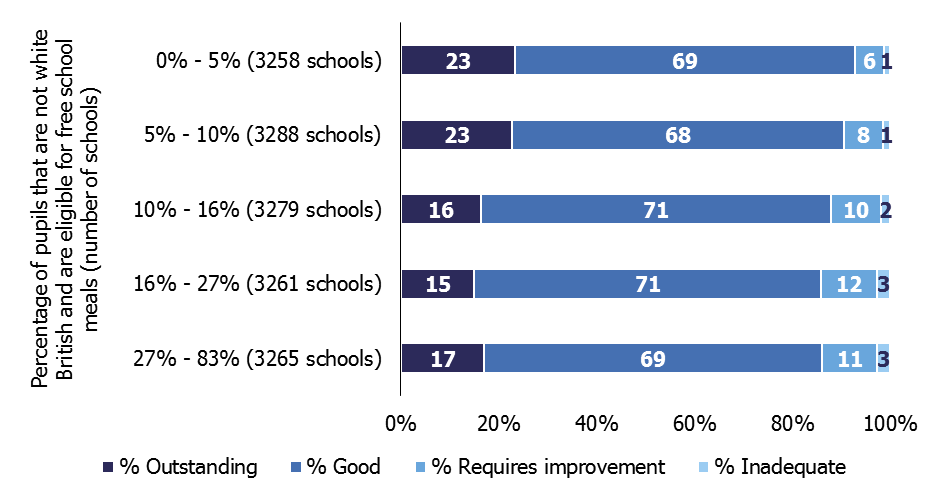
Note: Decimal places of the percentages were used for the rankings, but the nearest whole number is shown in the charts.
Percentages are rounded and may not add to 100.
Source: Ofsted inspection data as at 30 April 2018, and Department for Education census data January 2017


This is really interesting. Are you aware of any similar data linking %FSM / socio-economic make up of school population to overall Ofsted ratings for primary schools nationally?
Thanks in advance!
Posted by Hollie | July 2, 2021, 2:05 pmHi Hollie, simple answer is yes but not quite as pronounced. Primary graph is here https://leadinglearner.me/2018/06/12/graphically-exposing-ofsted-bias/
Posted by LeadingLearner | July 2, 2021, 3:03 pmThank you! This is incredibly helpful.
Posted by Hollie | July 7, 2021, 3:16 pm