Over the years, Ofsted has consistently claimed that schools working in deprived or challenging areas – their pupils, staff and leaders – are duly recognised for the quality of work they do. Often, using a graph very similar to the one below to justify their comments, they state how inspectors contextualise the inspection process. My view is “leading a school with a large percentage of disadvantaged white boys is statistically a career-ender”. Contextualisation is a myth.
The graph below is a variation on the one often used to explain how inspection is contextualised; after all 80% of schools in the most deprived areas are graded good or outstanding. This graph below uses eligibility for free school meals rather than the geographically based IDACI used previously; the data changes little. Using free school meals allows the graph to be further analysed at a pupil level based on different characteristics including ethnicity.
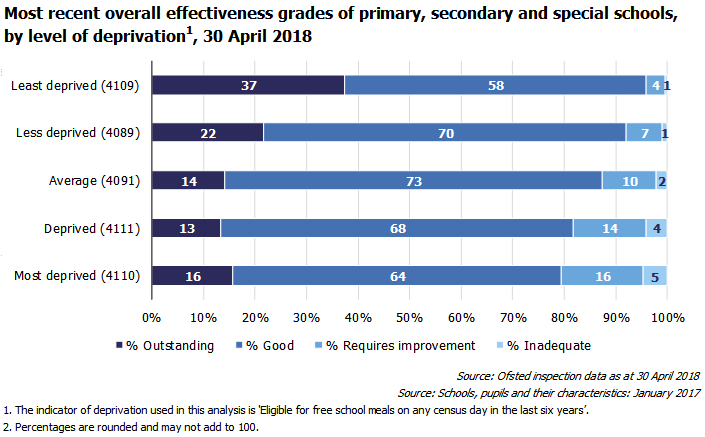
First analysis that may be of interest is analysis by phase. It shows a stark difference between Ofsted’s judgements in primary and secondary schools.

Whilst 81% of primary schools in the most deprived quintile were most recently judged to be good or outstanding by Ofsted; the figure plummets to 64% for secondary schools. The pattern follows for each quintile apart from the least deprived. Is there comparability between Ofsted’s judgements in primary and secondary schools? If yes, why the huge difference? It may be the cumulative effect of poverty over time; if so, it seems an odd reason to downgrade and school and damn it through an Ofsted inspection.

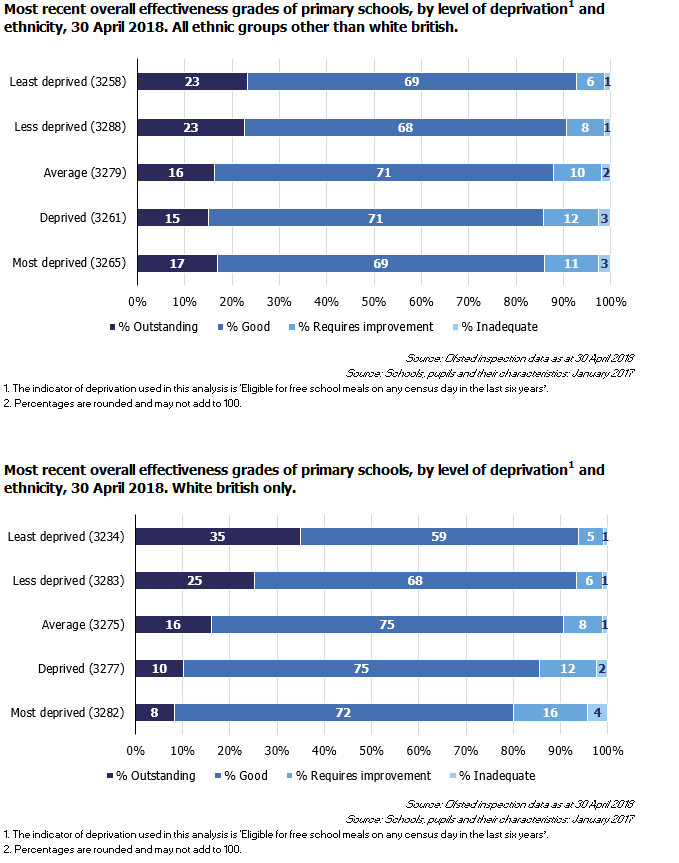
Cut the primary school data again for ethnicity and another interesting pattern appears. The comparison is based on schools with a high percentage of white British pupils compared to schools with a high level of other ethnic groups. For the least deprived quintile the Ofsted grades for schools at their most recent inspection shows a 6% difference in those graded good or outstanding. However, for other quintiles, based on deprivation, the pattern is really quite mixed.
Going back to secondary schools and the story is totally different. Already we’ve seen above Ofsted’s considerably harsher grading for secondary schools in the more deprived areas. Separate this out by ethnicity and the outcomes are cataclysmic for those schools in a deprived area with a high percentage of white British students.
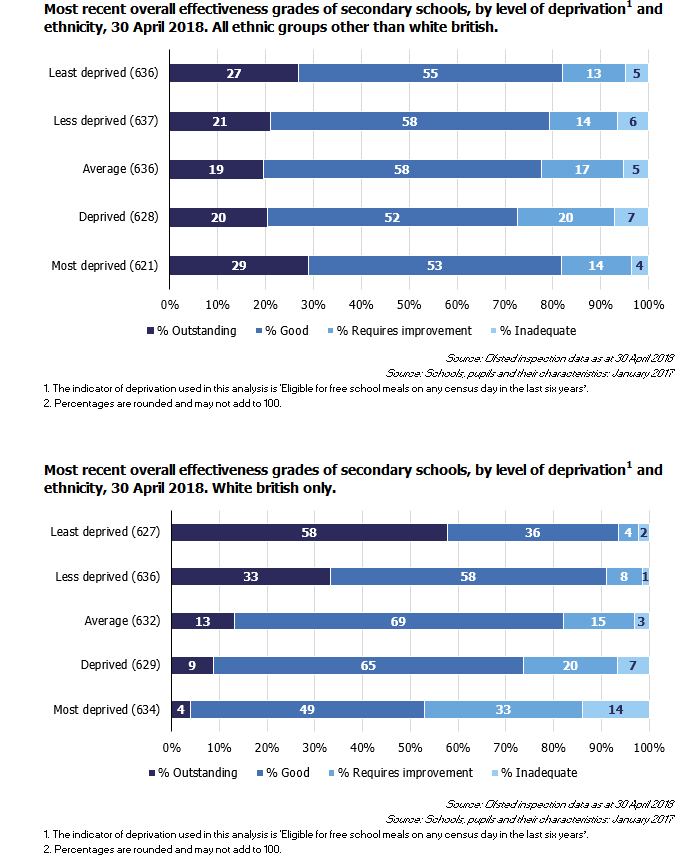
For secondary schools with a high percentage of other ethnic pupils (i.e. not white British) there are different percentages of Ofsted gradings for each deprivation quintile but nothing too earth shattering.
Compare that to secondary schools serving the most deprived quintile with a high proportion of white British; you’re statistically stuffed. Nearly half these schools will be graded inadequate or requires improvement compared to just six percent of schools from the least deprived quintile based on free school meals. The difference in outstanding grades awarded is outrageous; 4% in the most deprived quintile compared to 58% in the least deprived.
Wherever you work in a school these days I salute you; it’s walking the hard miles currently. To those working in the most deprived areas I salute you and take my hat off to you; you deserve so much better than this; recognition rather than shaming and losing your job. Ofsted don’t contextualise schools and this data exposes the myth. Your intake dictates your Ofsted outcome which is inextricably linked to you Progress 8 score.
Both ASCL and NAHT have accountability reviews underway. Please be bold and call to an end of the current Ofsted organisation rather than just another new framework that will continue to undermine the schools serving our most deprived communities particularly those with a high percentage of white British students. There are other better ways to improve schools, all of them; unreliable, invalid inspection processes need to go. I’d argue Ofsted are damaging schools who are already most fragile; serving the most disadvantaged communities.
With thanks to Ofsted for providing the graphs used in this blog.


Brilliant article. I think i will postcthat quote on my office wall. Reminds me of that scene in Band of Brothers when Captain Spiers says “the only hope you have is to accept the fact that you’re already dead. And the sooner you accept that, the sooner you’ll be able to function as a soldier’s supposed to function.”
Posted by Bill Fleet | June 12, 2018, 10:20 pmWow, this is hard evidence of something that we’ve been saying for years – brilliant piece of work. Schools in areas of socio-economic malaise AND with predominantly white British pupils are more often than not the schools that find it difficult to attract the best leaders. My hunch would be that it is these schools that also find it difficult retaining principled and ethical leaders, in it for the long-term. As you allude to, leadership is that important.
Posted by jerebarnesedu | June 13, 2018, 6:51 amThis is not about the quality of leadership. Many affluent schools with privileged intakes may well have average or below average performance for there context yet be judged outstanding or good. Schools with excellent leaders who serve the most deprived populations are judged to be inadequate based on flawed data. We seem unable to admit the unpalatable truth that privilege exists. We know that health and life expectancy are products of poverty, but we seem to want to pretend that a school’s success has got nothing to do with affluence and privilege, it’s all down to the leadership, which is just complete nonsense. Of course anybody pointing this out is making excuses and must have low expectations, unlike those leaders of affluent schools who are just brilliant leaders and do an amazing job.
Posted by Ian Butterfield | June 13, 2018, 10:54 amIt is my belief that OfSTED outcomes are fuelling inequality in our society.
“…we seem to want to pretend that a school’s success has got nothing to do with affluence and privilege.”
Only last week Amanda Spielman quoted “house prices rise 0.5% as a result of ‘good or better’ judgements”.
Posted by @TeacherToolkit | June 14, 2018, 9:41 amChoose to work in a challenging school? It could be the end of your [leadership] career https://www.teachertoolkit.co.uk/2018/04/29/lifeofadeputyheadteacher11/
Posted by @TeacherToolkit | June 14, 2018, 9:37 amSo this could be huge bias.
It could also be that schools in deprived areas are more challenging. More challenging schools find it harder to recruit teachers and leaders. Finding it harder to recruit teachers and leaders makes it harder to have the best quality teachers and leaders. Having the best quality teachers and leaders is closely correlated to the quality of the school. Ofsted may be broadly accurate about the quality of the school.
Of course this doesn’t make the challenge and smaller, and indeed the Ofsted grade could make the situation a vicious (or opposite) cycle and exacerbate it.
But there are possible other explanations.
Posted by mrlock | June 14, 2018, 9:11 pmMy question mark in the title was deliberate for all the reasons you’ve stated and more. Once the dust has settled a bit there is a fascinating discussion to be had. Thanks
Posted by LeadingLearner | June 14, 2018, 9:28 pmAs you said recently – teaching and leading teaching – is an act of LOVE. We need to enact that love as a profession for all of our children and young people, so that they can do the same in their turn. Those in deprived communities are most but not the only ones in need of the maps of meaning ecological education offers.
‘Ecological education suggests an organic relationship between practice and theory; learning communities and processes; subjects and disciplines; skills and competencies; as well as the natural, social and cultural systems that we navigate. Sustainable schooling houses that impulse’.
https://www.linkedin.com/pulse/sustainable-schooling-nathalie-bethesda/
Posted by Nathalie Bethesda | June 15, 2018, 7:36 amWhy do people struggle to realise that the context is the issue? We seem to be looking for every explanation other than the obvious one. Having worked in schools of all contexts, I have found that great teachers are to be found in all of these establishments. Do we blame poor doctors for higher disease rates in areas of poverty, or poor dentists for greater tooth decay, or poor police for higher crime rates, domestic violence and drug addiction or mental health services for increased mental health issues. Only by facing up to the uncomfortable truth can we address it, but blaming schools for the effects of poverty seems a little topsy turvy.
Posted by Ian Butterfield | June 14, 2018, 10:43 pmThat’s a really valid point and also true in my experiences of working in 1-4 schools. I guess the issue is, are lead doctors sacked when hospitals are failing? Do hospitals struggle to recruit (also) when placed into Special Measures? I suspect so… but I’d be keen to see the research and see it that stacks up.
Posted by @TeacherToolkit | June 14, 2018, 11:02 pmOn the contrary, I’m accepting that context is likely to be the issue, but that context may also be a genuine reason schools aren’t as good, rather than a biased regulator. You seem to be comparing outcomes in some professions with regulation in this one, which is far from the same (and in some of those cases the “blame” is actually centred exactly where you suggest it’s not). But that’s again not my point. I’ll make a tangental point in another comment. My point here is there are a number of possible explanations, and the hypothesis of the regulator being biased against schools in deprived areas is not one that is proven by this data.
Posted by mrlock | June 15, 2018, 8:05 amIncidentally, it’s also harder to recruit doctors and healthcare workers in areas that are more challenging. But you know.
Posted by mrlock | June 15, 2018, 8:06 amI’d hope that as professional educators we believe we can make more of a difference rather than deterministically shrugging our shoulders at the fate of those who come from the wrong side of the tracks or the wrong area. An education secretary whom some of the profession are pleased has gone used to talk of the ‘soft bigotry of low expectations’ and I hate it when we fall into the trap of illustrating that he can be correct. When we say “what are we supposed to do – they’re poor” we do exactly that.
Posted by mrlock | June 15, 2018, 8:08 amOne the one hand I agree the use of FSM as the lens but on the other would float the idea of using the DfE/Ofsted lens of disadvantaged learners in receipt of Pupil Premium which embraces FSM. This may well serve to hoist the latter organizations on their own petard.
To contextualise this if we go back to Mr Gove one of his last actions was to disband national curriculum levels and sub levels and place the rigour and evaluation of a pupils progress with schools. This left Ofsted high and dry in relation to expected and exceeding progress within subjects (and indeed across the curriculum). The KS2 SATs replacement culminating in the judgement as to whether a child was ready for the programs of study as KS3, only served to exacerbate matters ( e.g. was it the equivalent of the old L4? What should happen with children deemed not ready? Should the assessment be sat again in Y7?). Some of this is water under the bridge but it sets up the question as to what is the DFE/Ofsted baseline that is being used to underpin their data projections for pupil progress in the Secondary phases? Is it a hidden range of fine numbers similar to those beneath national curriculum levels and sub levels and if so is that legitimate in the assessment without levels era?
The real crunch here is that the inspection handbook perpetuates that progress is benchmarked by each pupils attainment at the time they joined their current school, and in the absence of levels and sub levels (and the underlying fine number data), so upon what do Ofsted rely for their judgements on Pupil progress? Thus for me the issue is more a matter of the integrity and honesty of an inspection system that bases judgements on redundant illegitimate data as a premise for evaluating progression.
Posted by Andy | June 19, 2018, 2:01 pmThank you so much for this article.
Having worked in secondary schools with high intakes of white British boys all my career, you have just proved what I only had anecdotal evidence for beforehand. Everyone in our schools understands this.
We often talk about how schools are accountable for the success or students till the age of 18, but who is then is accountable for people’s success or otherwise. There is literally no accountability for what happens once we become adults (not that I am suggesting this is a good thing to do and God forbid our government is actually held accountable).
For me the big issue is jobs and career prospects. When you work in inner city areas, you quickly realise that most employment opportunities are in the tertiary sector, which evidence suggests is far more likely to favour women. For girls, education is a way out. For boys, job prospects often involve working in a relative’s small business in the secondary sector. They will get this job whether they do well at school or not.
For me, there will be no significant improvement in outcomes for disadvantaged groups until a huge investment is made in developing industries in our most disadvantaged areas, thus providing students with an incentive that is tangible. Work hard –> get a good job at local industry.
I guess that isn’t what Ofsted want to hear though…
Posted by Andrew Ryan | February 23, 2019, 7:05 am