For many of us #SLTChat on a Sunday evening has become an addictive part of the weekend. It is often an action packed and adrenaline fuelled outpouring of tweets and ideas with some of the most rapid sharing of practice you will ever find.
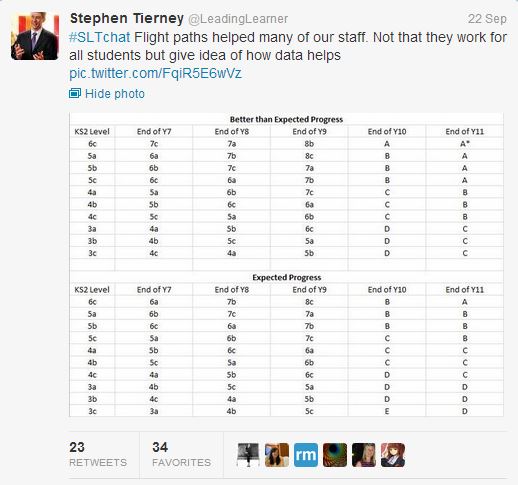
The most popular question on the 22nd September, hence it was topic 2, is below:

Last academic year I ran a session on outstanding teaching & learning for staff. An early part of the CPD was focussed on unpacking the idea of measuring “progress over time”. The basic idea is that students who are taught well make more progress than those who are not. It seems a reasonable assertion to me – teaching and teachers matter particularly teaching and teachers that have a big impact on students’ learning. Converting three levels progress from Key Stage 2 to 4 (at and above national averages equates to Ofsted Good) and four levels progress (at and above national averages equates to Ofsted Outstanding) into smaller chunks has led many schools to think in terms of “flight paths” hence my tweet below:
 The linear nature of these flight paths didn’t go down well with all tweeters and the comments about the non-linear nature of learning is valid.
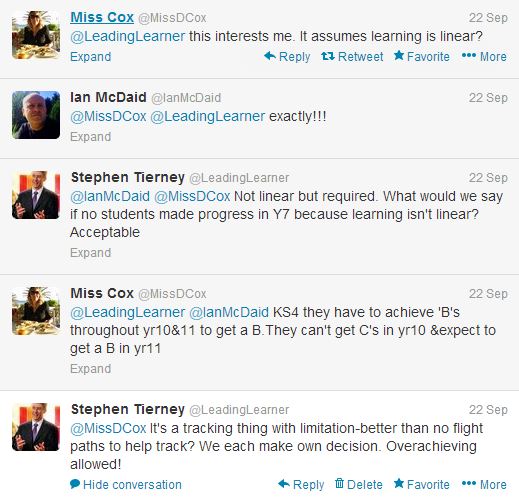
However, over a year, key stage or whole primary or secondary school education the peaks and troughs of non-linear learning need to lead overall to a student making good progress. This is what I would want for my own children and so this is what I want for all students at St. Mary’s Catholic College and Christ the King Catholic Primary School.
Flight Paths
The basic idea, within the INSET session, mentioned above, was that the difference between a student moving three sub-levels in an academic year as opposed to two sub-levels a year is the difference between World Class progress and Good progress. World Class progress can look rather frightening:

For students making two sub-levels progress a year, good progress in a secondary school, the “flight paths” look like this:

Please note: The ten sub-levels over five years rather than nine sub-levels (three levels progress) was introduced because it was just simpler mathematically to model.
The interesting challenge is, “What would we have to do to help students progress, on average, a sub-level per term instead of one sub-level per term and a half?” As you can see impact over five years is impressive. Out of this INSET has come some petty honest discussions with ourselves about the Key Stage 3 Curriculum which just wasn’t demanding enough of students and leading to a lack of progress. The fruits of these discussions are still being worked on and we are giving considerable time to a radical overhaul of Key Stage 3 to substantially increase the level of challenge and we hope in turn progress.
Accountable Against Outcomes Not Targets
One of the key mind shifts needed, if we are going to make effective use of targets, is to not hold teachers accountable against them. This is not some tweed wearing, left wing, enemy of promise approach to education. Schools, and the teachers within them, need to be held accountable for the outcomes achieved by students, for example, what percentage of students made three, four or even five levels of progress from Key Stages 2 to 4 or in primary schools two or three levels of progress from Key Stages 1 to 2. Rather this is a reframing of our use and understanding of targets. Targets should be used to create gaps in learning, outcomes are for accountability.
Targets & Learning Gaps
Targets need to be agile, flexible and adaptable to ensure there is always a “gap in learning”. The gap in learning is produced by having a target that is always in advance of the student’s current attainment.
Agile Targets
These are targets linked to learning intentions and determined at the classroom level. They form a part of all effective teachers’ repertoire, whether they think about it in these terms or not. “Where are you up to now?” “OK, this is where to next … (agile target setting).” The teacher now works with the student to fill the gap in learning created by the new learning intentions. A simple example of this in action is formative assessment with a student expected to respond to the feedback by producing a new improved piece of work at a higher level. The teacher will then set a new target for the student to create a further gap in learning between her/his current attainment and future attainment. This continual revising of the learning intentions between teachers and students is linked to the use of “agile targets”.
Flexible Targets
These I tend to think of as numerical targets that are renegotiated by teachers as part of their work with students over an academic year. If a student reaches their end of year or key stage target early then there needs to be a re-establishing of a gap in their learning by an extended target being set. This makes allowance for the non-linear nature of learning with students making more rapid progress than expected acquiring new targets mid-year or key stage. The term “flexibile target” indicates that targets may indeed change over time – that gap in learning between current and future attainment needs to be maintained – but it is not a lesson by lesson or within lesson change as discussed above.
Adaptable Targets
When targets are set, often at the beginning of Key Stage 2 or 3 or 4, which students prematurely achieve, due to their accelerate progress, there needs to be a resetting of targets. To repeat myself the gap in learning, between current and future attainment needs to be reset. This can be part of a formal process. After the INSET last academic year we determined that we were going to set targets for students that would lead to outstanding outcomes which look like this:

If a student actually managed to overachieve against these targets then at the beginning of each academic year they are formally reset.

A student joining us in Year 7 on a 4B will be targeted a 5B by the end of the year. However, if s/he makes four sub-levels progress thus achieving a 5A then their targets for Year 8 and onwards will be revised upwards.
I have a sense, if you’ve read this far, that this is one of those love it or hate it type of posts. Trying to straight jacket people into a statistical model doesn’t always feel that comfortable but I believe we do need a way to review whether the progress being made by students is acceptable or hopefully better than expected. Targets are important but they need to be linked to the creation of gaps between current and future attainment not accountability.
A PDF of the flight paths is here: Flight Paths – Good, Outstanding & World Class
There is more to add to this idea of flight paths, as there are nuances, linked to “Changing Flight Paths and Interventions” which considers early intervention in Year 7, challenging the most able and how students & teachers can take the lead on using personalised targets and flight paths within the learning process.
Whilst this is still one of my most popular posts there is some new thinking that may be of interest in DIY Teaching CPD: Structure and Sequence


Really interesting post. This is something we have introduced, though even setting targets along the lines of ‘good’ progress has been controversial. Can I ask whether you have introduced this in all subjects or just the core? How do you deal with PE for example, where student ability does not correlate so well with average KS2 level?
Thanks, Rob.
Posted by Robert Gray | October 3, 2013, 3:33 pmDear Rob
We introduced for all subjects last year. They choose either the KS2 En or Ma as a baseline. Some subjects, for example PE, are looking at baselining again for their subject. They must have targets overall that are the same as if they had chosen En/Ma but might set them for different children. Early days for them with this approach so don’t know whether it will work
Hope this helps. Regards Stephen
Posted by ExecutiveHT | October 3, 2013, 3:44 pmWe are in a similar position with PE too. The school have introduced flight paths for all subjects that students have in their planners. We have also introduced the FGS target which for most students in KS4 is 4 levels of progress from KS2. We were unable to amend these targets other than increase them. We are trying to build a culture that potential shouldn’t be capped and raise the question….”why can’t all pupils achieve an A?”
In principle I do agree with this but for talent based subjects it becomes very hard to get every student an ‘A’ particularly when 60% of their final grade is based on practical performance. So we have created our own spreadsheet of ‘realistic targets’, which we will monitor rigorously parallel to the FGS target.
For KS3 students we are baselining at the beginning of each year group and completing core tasks for each sport we deliver. We also internally standardise levels and externally standardise with other schools in the area. I am also thinking about introducing a cognitive element after a discussion about this blog (exam/test) so that I can get a wholistic picture of the students.
Posted by Danielle Tedford | October 5, 2013, 9:10 amThanks Danielle,
This adds to the post really well. Keep in mind that targets create learning gaps. Great positive thinking about all students getting an A. Now just need to work out how to achieve it! Good luck.
Posted by ExecutiveHT | October 5, 2013, 9:15 amThat’s a really interesting post. I’ve also begun to use flightpaths, but calibrated mine using RaiseOnline transition matrices for English and Maths. Typical progress from KS2 to KS4 varies from as little as 7 to as much as 13 sublevels nationally. Beginning at a KS2 start point of 3c, the national progress is to E on average (with a lot of variation) i.e. 7 sublevels. From a KS2 start point of 4c, average outcome rises to C- (9 sublevels), and from KS2 start of 5c, it rises to B (10 sublevels). At 5a, I estimate as much as 13 sublevels progress to A*- nationally, again with a lot of variation.
I used these as a starting point for my flightpaths and added in two extra sublevels for ambition.
I’ve ignored all differences between subjects (you could argue the point, but just look how little variation there is in FFT estimates between subjects) and generally suggested that subjects outside English & Maths do their own baseline estimates of attainment as soon as Y7 get in the door. This means that even without a KS2 score, other subjects can follow the general progression of a flight path, and it works for students coming in during Y8 or Y9.
I think a visual display of these flightpaths is vital as eyes glaze over with tables and letters and numbers. I’ve shown my visuals here – http://jtbeducation.wordpress.com/2013/08/19/displaying-student-progress-visually-flight-paths/
Posted by runningdown | October 6, 2013, 10:07 pmSorry your data is wrongly projecting progression. There are individual flight paths based on entry points, to reduce this to 3 isn’t logical…National conversion suggests many variables.
Posted by Paul Wilkinson (@pwilkinson72) | May 9, 2014, 8:45 pmHi Paul
Not sure I fully understand your comment. The tables show ten entry points and two different models of progression. The follow up post deals with changing flight paths.
Regards
Stephen
Posted by ExecutiveHT | May 9, 2014, 10:08 pm