 The educational attainment of students entitled to free school meals and children looked after is below that of their more affluent peers. This is simply unacceptable and it is part of our collective moral purpose and “preferential option for the poor” to close this gap in attainment.
I’m not one to lavish praise on Secretary of States for Education or the Department for Education, mainly because they don’t often deserve it, but the introduction of Pupil Premium funding is a great decision. We must use it to maximum impact, long may it continue. This isn’t all about quick fixes and there are some long hard miles ahead of us if we are to eradicate the educational disadvantage currently experienced by some of the poorest students in our communities.
When I review the Pupil Premium data, published on our website www.st-mary.blackpool.sch.uk there are a lot of positive indicators of the impact we are having on students who are entitled to the funding. In addition, the value added of CLA/FSM students, in the 2012 RAISEonline, is statistically above average at 1006.9. However, achieving 5+A*-C with English & Maths is the passport out of poverty and disadvantage for these young people and we need to do better.

We currently get just over £280,000 of Pupil Premium funding for students who are receiving or have received free school meals in the last six years (FSM Ever 6), children looked after and children whose parents are in the services. By far the biggest group in St. Mary’s is the FSM Ever 6 with about three hundred and fifty children in this group. This year the Pupil Premium funding has been committed to generally strengthening educational provision at the College through employment of additional Assistant Headteachers, to act as senior heads of learning houses, and more Pastoral Managers. Funding has also been specifically targeted to provide: additional Maths and literacy support, the PROGRESS Group, laptops for students, additional money for food at break & dinner in the canteen and to purchase school uniform.
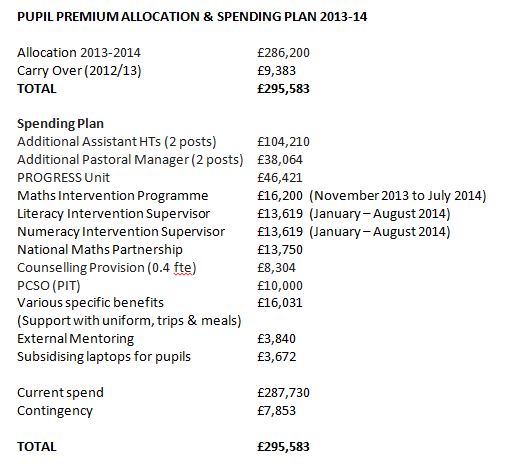
The balance of general strengthening and specific interventions is important as this is about building capacity to maintain a very high generic experience, this benefits all students, as a calm, focussed atmosphere pervades the College, and specific intervention where and when needed.
Eyes On, Names On, Actions On
A summary of advice from Ofsted is:

We must ensure that students are on track to achieve from the beginning of Year 7 and simply can’t wait until Key Stage 4 or Year 11 and try to turn on the turbo boosters. So the first part of our process must to ensure that we have “eyes on” the issue and act collectively to close the gap. The next stage is ensuring that we can put “names on” the students in receipt of Pupil Premium funding. The “names on” approach is for: subject teachers and heads of department; form tutors, pastoral managers, heads of house and senior heads of learning houses and senior leaders who all have a part to play.
We need to know:
- Which students are making expected or better than expected progress?
- Which interventions have had impact?
- Which students need more or different interventions?
Students in receipt of Pupil Premium are a heterogeneous group and we need to respond to them in a personalised and individual manner. This is our first attempt at putting together a Pupil Premium Analyser and Tracker. You can download a copy of the spreadsheet from the bottom of this post or on the Ofsted Resources page on my blog. The screen shots are from the secondary version of the spreadsheet but there is also one for use by primary schools. Thanks to John Jenkins for his work on this and senior staff at St. Mary’s for their advice and suggestions that helped improve the initial version.
![]()
The above tracker is a first attempt to look at a way of analysing this relatively large group of students in a way that will lead to them becoming increasingly successful. It has three main sections:
- Base data on each student
- Academic Progress, Attendance & Exclusion Data
- Red, Amber & Green (RAG) Rating and Interventions
Base Data
The following base date is available from most management information systems and can be transferred into the spreadsheet. Students with multiple challenges, for example, those with English as an additional language, at School Action Plus or with a Statement of Special Educational Need, alongside the Pupil Premium factor, need particularly close scrutiny as they may have complex barriers to learning.
![]()
The inclusion of basic literacy & numeracy information is important as students who are not functionally literate or numerate will not be able to effectively access the curriculum. In their first few weeks in St. Mary’s, all Year 7 students take a literacy and numeracy test in their English and Maths lessons respectively. The outcomes of these tests are then converted into a standardised score with 100 being “average”. Student with low literacy or numeracy scores receive additional support.
Students’ standardised scores in literacy and numeracy are colour coded in the spreadsheet:
- Red – below functional literacy (Standardised Score below 84 – Low)
- Amber – just at functional literacy (Standardised Score 85-89 – Low Average)
- Green – functionally literate and numerate and should be able to access the curriculum
In the primary Pupil Premium Spreadsheet literacy and numeracy are replaced by reading and spelling ages. Any pupils with reading or spelling ages below their chronological age are a cause for concern.
Academic Progress
The data on students Key Stage 2 outcomes – level and sub-level – can be transferred from most management information systems and transferred into the spreadsheet along with the students’ end of year level & sub-level in English & Maths.
![]()
A students’ academic progress is RAG rated automatically by the spreadsheet:
- Red – below expected progress
- Amber – at expected progress
- Green – Better than expected progress
The “Progress and Flight Paths” for secondary schools (see second tab of the spreadsheet) are based on:
- Expected Progress – two sub-levels progress in each of Y7-9 and three sub-levels in Key Stage 4. This equates to three levels progress from Key Stage 2 to 4. Less than this is “Below”
- Better than Expected Progress – seven sub-levels in Key Stage 3 with three sub-levels in Y7 and two in each of Y8 & Y9. Five sub-level in Key Stage 4 with three in Y10 and two in Y11. This equates to four levels progress from Key Stage 2 to 4.
Whilst the first challenge will be to ensure students are making expected progress the reality for many students entitled to Pupil Premium is that they are already lagging behind their peers when they enter secondary school and this gap then increases. We will need to target students at levels 4c, 3a & 3b and seek to accelerate their progress at the beginning of secondary school to ensure they rapidly reach level 4b (now termed “secondary ready”) and attain at least 6b by the end of Y9. I’ve written in more detail about this and flight paths generally in “Changing Flight Paths and Interventions”.
Progress for Primary schools is RAG rated based on:
- Expected progress – two levels from Key Stage 1 to 2. Just a word of caution here – a sub-level gives a point score of 2, so with three sub-levels making a level each, level is a gain of 6 points. Two levels progress from Key Stage 1 to 2 is 12 points. Nationally pupils’ progress from Key Stage 1 to 2 is over 13 points, that is, on average pupils make a bit more than two levels progress – this is an important point as Ofsted Inspectors pick this up when looking at progress over all.
- Better than Expected Progress – three levels progress from Key Stage 1 to 2. The spreadsheet has been set up with two sub-levels progress expected in Years 3, 4 & 5 and three sub-levels in Year 6.
- When entering data for pupils who got a levels 3 at the end of Key Stage 1, remember this is a 3b.
Attendance and Exclusion Data
Student’s attendance is automatically RAG rated, for secondary schools, with:
- Red – below 92%
- Amber – 92-92.9%
- Green – 93% or higher
In Ofsted’s subsidiary guidance 92.61% or lower attendance, in a secondary school, is a “trigger” for concern hence the RAG rating above.
This changes in the Primary School spreadsheet to:
- Red – below 94%
- Amber – 94-94.9%
- Green – 95% or higher
In Ofsted’s subsidiary guidance 94.24% or lower attendance, in a primary school, is a “trigger” for concern hence the RAG rating above.
The Persistence Absence box is again automatically RAG rated:
- Red – 85% or below
- Amber – 85-90%
- Green – 90%+
Exclusions
- Red – Secondary 4+ days & primary 1+ day in a rolling twelve month period
- Amber – Secondary 1-3 days in a rolling twelve month period
- Green – Zero days of exclusion in a rolling twelve month period
Interventions
If you have read this far congratulations but the real work has not yet begun. The real work is closing the gap not just identifying those students who are most likely to become part of the statistic in the years to come.
This in essence is the critical stage that will require the greatest professional judgement. Based on the indicators before an overall RAG rating will be needed for each student.
- Red – Immediate intervention needed
- Amber – Keep a watching brief
- Green – No additional assistance required at the moment
Any previous interventions can then be recorded so you can see the impact of these. For any student with a “Red” RAG rating there needs to be an appropriate set of interventions determined, using the analysis. These then need to be implemented, monitored and reviewed. This is part of the moral purpose within education and for the sake of our most disadvantaged children we cannot afford to fail the.
Please find below the Pupil Premium Analyser and Trackers for Primary & Secondary Schools:
Whilst this has been specifically written with analysing and tracking students entitled to Pupil Premium funding it could equally be used for any sub-group or all students.


Hope the student names are anonymised or they have given permission!
Posted by Steve | October 11, 2013, 5:24 pmLol Steve. Jack & Jill Hill may be appearing in a nursery rhyme near you sometime soon. Regards, Stephen
Posted by ExecutiveHT | October 11, 2013, 6:25 pmThank you for sharing!
Posted by Jenny Anderson | October 29, 2013, 7:27 pmHi, thanks for sharing this. Found it a really useful starting point and scaffold for developing a similar tool in school to be used as an ongoing tracking tool throughout the year by tweaking and making a couple of additions. All built now and looking forward to using it for the first time next week.
Posted by ded2je | November 28, 2013, 5:47 pmMany thanks for sharing this – it is very helpful!
Just one thing though..”Any pupils with reading or spelling ages below their chronological age are a cause for concern” This is not correct and contradicts what you say about the standardised scores which in my view is exactly right. Let me give an example: A pupil of 10:00 with a Reading/Spelling Age of 10:00 will have a standardised score of 100. They would have to have a reading/spelling age of below 8:00 (I am guestimating this but it would be at least this..probably lower) to be below the average range i.e. below a standardised score of 85. If you use reading tests on an average population you would expect half to have scores of 100 and above and half to have scores of 100 and below – it is the normal distribution (the bell graph). I know that MPs and the general public think that a Reading Age should match the Chronological Age but this is incorrect…it isn’t a level set on the standard that should be achieved; instead it shows the mean – the score that is the performance expected if you lined up 100 pupils and this one was the 50th along the line in terms of ability. Carol
Posted by Carol | September 11, 2014, 10:37 amGot it. Great additional information for people. Thanks
Posted by ExecutiveHT | September 11, 2014, 11:29 am